Loading... Please wait...
- Home
- Guru
-
MEGA List
- MEGA List Page
- Categories
- All Brands
- Trading Books
- AdvancedGET
- MetaStock
- MetaStock Add-ons
- MetaStock Plug-Ins
- MetaStock Utilities
- MetaTrader
- MetaTrader EA
- MetaTrader EA (Forex)
- NinjaTrader
- Statistical Analysis
- TradeStation
- TradeStation Add-Ons
- Trading Software
- Betting Exchange Software
- Mega Page - New Stuff
- Personal Development Courses
- More MEGA LIST
- More Courses_
- Books
- More Books
- Mega List #1
- Mega List #2
- Mega List #3
- Real Estate
- Course by Category #1
- Course by Category #2
- Course by Author #1
- Course by Author #2
- Course by Author #3
- Course by Author #4
- RosettaStone
- Mega Page - 0
- Mega Page - A
- Mega Page - B
- Mega Page - C
- Mega Page - D
- Mega Page - E
- Mega Page - F
- Mega Page - G
- Mega Page - H
- Mega Page - I
- Mega Page - J
- Mega Page - K
- Mega Page - L
- Mega Page - M
- Mega Page - N
- Mega Page - O
- Mega Page - P
- Mega Page - Q
- Mega Page - R
- Mega Page - S
- Mega Page - T
- Mega Page - U
- Mega Page - V
- Mega Page - W
- Mega Page - X
- Mega Page - Y
- Mega Page - Z
- MEGA CATALOG
- Search MEGA CATALOG
- Entire 3TB Hard Drive for DayTraders - For Sale $3K
- Entire 4TB Hard Drive for DayTraders – For Sale $4K
- BigBoss Hard Drive for DayTraders – For Sale $3K
- MONEY Catalog
- Some More Courses
- dvd
- estore
- libr
- shop
- store
- Portfolio
- BigBoss Hard Drive for DayTraders
- Latest Database
- FAQ
- Info
-
Market Summary
- Corona Virus Stocks
- FREE IBD WEEKLY
- FREE STOCK CHARTS
- Market.Summary
- IBD 50
- DOW 30
- NASDAQ 100
- CNBC IQ 100
- IBD Sector Leaders
- IBD Stock Spotlight
- IBD Big Cap 20
- IBD CANSLIM Select
- IBD Global Leaders
- IBD IPO Leaders
- IBD New Highs
- IBD Rising Profit Estimates
- IBD Relative Strength At New High
- IBD Stocks That Big Mutual Funds Are Buying
- IBD Weekly Review
- IBD Stocks On The Move Up
- IBD Stocks On The Move Down
- Zacks Rank #1 Strong Buys
- Zacks Rank #5 Strong Sells
- Zacks Focus
- SPDR XLB Basic Materials
- SPDR XLC Communication Services
- SPDR XLE Energy
- SPDR XLF Financial
- SPDR XLI Industrials
- SPDR XLK Technology
- SPDR XLP Consumer Staples
- SPDR XLRE Real Estate
- SPDR XLU Utilities
- SPDR XLV Healthcare
- SPDR XLY Consumer Discretionary Goods
- Direxion Leveraged & Inverse ETFs
- IBD Innovator ETFs
- Technology ETFs
- Select Sector SPDR ETFs
- MARKET_SUMMARY
- 52 Week High Stocks
- 52 Week Low Stocks
- AGFiQ ETFs
- Airline Stocks
- Barron Stock Picks
- Bond ETFs
- IBD CANSLIM Grand Slam
- Casinos Gaming Stocks
- Commodity ETFs
- Equity ETFs
- ETF Investor
- First Trust ETFs
- Four Horsemen
- Home Run Investor
- IBD Breakout Opportunities ETF
- IBD Breakout Stocks
- IBD Dividend Leaders
- IBD ETF Leaders
- IBD Income Investor
- IBD REIT Leaders
- IBD Tech Leaders
- IBD Utility Leaders
- Income Investor
- International ETFs
- Invesco ETFs
- iShares ETFs
- JPMorgan ETFs
- Large Cap ETFs
- Marijuana Stocks
- Mid Cap ETFs
- ProShares ETFs
- REITs
- Sector ETFs
- Small Cap ETFs
- SPDR State Street Global Advisors ETFs
- Stocks at All Time Highs
- Stocks at All Time Lows
- Stocks Under $10
- Top 80 Technology ETFs
- Travel Hotel Stocks
- US Small Cap ETFs
- USAA ETFs
- Value Investor
- Warren Buffett Berkshire Hathaway Portfolio
- WisdomTree ETFs
- Zacks Top 10 Stocks
- Market Summary 2
- Publicly Traded Advertising and Marketing Stocks
- Publicly Traded Aerospace & Defense Stocks
- Publicly Traded Agricultural Stocks
- Publicly Traded Aviation Stocks
- Publicly Traded Biotech Stocks
- Publicly Traded Building Product and Materials Stocks
- Publicly Traded Business Service Stocks
- Publicly Traded Chemical Stocks
- Publicly Traded Clean Energy Stocks
- Publicly Traded Clothing and Footwear Stocks
- Publicly Traded Construction Stocks
- Publicly Traded Consumer Goods Stocks
- Publicly Traded Consumer Service Stocks
- Publicly Traded Cyber Security Stocks
- Publicly Traded Education and Training Stocks
- Publicly Traded Energy Stocks
- Publicly Traded Entertainment Stocks
- Publicly Traded Environmental Services Stocks
- Publicly Traded Financial Sector Stocks
- Publicly Traded Food and Beverage Stocks
- Publicly Traded Game and Hobby Stocks
- Publicly Traded Health and Fitness Stocks
- Publicly Traded Healthcare Facilities Stocks
- Publicly Traded Healthcare Stocks
- Publicly Traded Home Furnishing and Improvement Stocks
- Publicly Traded Industrial Stocks
- Publicly Traded Insurance Stocks
- Publicly Traded Internet Stocks
- Publicly Traded Materials Sector Stocks
- Publicly Traded Media Stocks
- Publicly Traded Medical Device and Equipment Stocks
- Publicly Traded Metal and Mining Stocks
- Publicly Traded Motor Vehicle Stocks
- Publicly Traded Multi Sector Stocks
- Publicly Traded Office Equipment and Supply Stocks
- Publicly Traded Pharmaceutical Stocks
- Publicly Traded Real Estate Stocks
- Publicly Traded Regional Major and Foreign Bank Stocks
- Publicly Traded REITs Stocks
- Publicly Traded Restaurants Stocks
- Publicly Traded Retail Stocks
- Publicly Traded Semiconductor Stocks
- Publicly Traded Shipping Stocks
- Publicly Traded Sin Stocks
- Publicly Traded Software Stocks
- Publicly Traded Sports Stocks
- Publicly Traded Technology Stocks
- Publicly Traded Telecommunications and Communications Stocks
- Publicly Traded Transportation Stocks
- Publicly Traded Travel and Tourism Stocks
- Publicly Traded Utilities Stocks
- SPDR Corporate & Government Bonds ETFs
- SPDR International ETFs
- Top 97 International Equity ETFs
- Portfolios
- Stock Charts
- MEGA VAULT
- Stream Movies
Categories


- Home
- MORE Courses
- Trading The Tape by Scott Maxie - How To Trade Using Order Flow Analysis

Product Description
TradingTheTape was founded in 2006 to study how volume affects market momentum. Not volume per bar but rather volume at price per bar in order to profile support and resistance levels relative to current price action. With this study it became apparent that market knowledge was not enough and that trader discipline was also critical…and elusive. This led to automated trading strategies that placed and managed trades based on criteria pre-determined by the user and without any further input from the user. Today these program trading strategies run on Chicago-based dedicated servers that can be controlled by smart phones. Current software development is focused exclusively on automated order flow analysis for both scalping and trend trading, both discretionary and fully automated program trading.
TradingTheTape by Scott Maxie
“Order Flow Determines Price Action ~ To See The Future, Watch The Order Flow”
How to trade using Order Flow Analysis (Tape Reading)
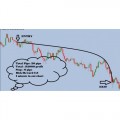
What is ‘the tape’? Think of a trader in the 1930's jumping out of a 40 story window trailing a long paper tape behind him and you get the idea. He just read the tape and all his holdings are plummeting on heavy volume…i.e. the market momentum is screaming down, it is not coming back and he is wiped out. The tape back then literally referred to a ribbon of tape spewing out of a glass-domed ticker machine (hence the term ‘ticker tape’) with a live market data feed with prints on the tape of the last price and volume of various market instruments. In good times there would be ticker tape parades. In bad times there would be ‘jumpers’. The ‘tape’ therefore refers to order flow which is volume at price, i.e. what size traded at what price.
Today the tape figuratively refers to the typical Time and Sales window shown below. Same concept of volume at price and colored as to whether the last trade was at the Bid or the Ask. The problem with the Time and Sales window today is that, even if you could read it, it can and does give misleading information relative to expected price action. For example, a rapid series of green prints does not necessarily mean the market is going up and one should buy. Instead the prints could all be at the same price and the ‘big money’ is absorbing all the hits on the Ask until the market is forced down. In this case all those green prints mean sell.