Loading... Please wait...


This ThinkorSwim indicator is a better range finder that has the goal of setting reasonable expectations for intra-day price movement.
A Better Range Finder
Where might price go today?
To establish reasonable expectations, I need to know things such as:
- On average, how far does price move up from the open to the high of the day?
- On average, how far does price move down from the open to the low of the day?
- What is the average daily price range?
Once that data has been gathered, standard deviations are calculated then the average price range is expanded by one standard deviation. According to statistics, the intra-day price movements should fall within that expanded range (avg range + 1SD) roughly 70% of the time.
Any price movement within that expanded range would be considered “normal.” Price moves beyond that expanded range would signify a large move for the day.
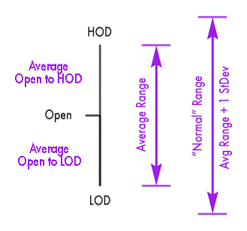
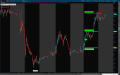
The Better Range Finder plots the average and normal ranges on the chart to show where intra-day prices might go. Initially, the full range is extended upward from the open to show how far price might extend if it were to open and continue higher for the rest of the day. Likewise, the full range is extended downward from the open to show how far prices might fall.

As the day progresses, the upper and lower range boundaries are moved inward to reflect actual price movement. The upper boundaries will always be extended by the range size from the current low of the day and the lower boundaries will be extended downward from the high of the day.
The areas representing the average open-to-HOD and open-to-LOD are painted. The line between the two areas is the open of the day.

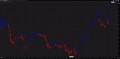
This clip shows a slightly below average sized move.
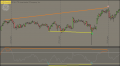
This clip show a larger than average move that is still within the bounds of a “normal” move.
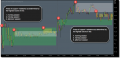
The default look back period for determining average range is 30 days, but may be changed from the chart settings panel.

The video below may help to explain the concept a little better. The presenter describes projecting the daily average lines upward from the low of the day and downward from the high of the day and that is exactly how the lime green and purple lines react in my script.
The lime green lines correlate to the average daily range mentioned in the video. The purple lines expand that range by one standard deviation.